
 This is Alpha, the first-born, when he was 2YO.
 This is Beta, the second-born, when he was about 2YO.
 This is Gamma, the third-born, when he was about 18MO.
Venn Diagram of Candy Bars
Feb
21
2012
Yesterday I presented a flowchart of candy bars. But I think a flowchart is not the best way to show the variations of candy bars and their ingredients.
What is the best way?
A Venn diagram!
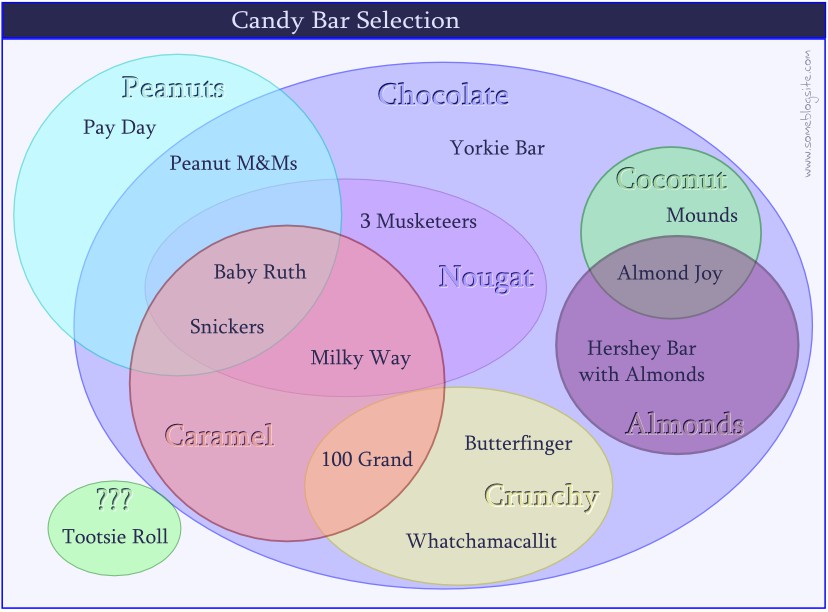
I suppose it would be more appropriate to call this an Euler diagram rather than a Venn diagram, but not many people know or care about the difference.
I took the little book out of the angel’s hand and ate it, and in my mouth it was sweet as honey; and when I had eaten it, my stomach was made bitter.
Revelation 10:10


This little article thingy was written by Some Guy sometime around 6:32 pm and has been carefully placed in the Food category.