Archive for 2009

Presidential Stock Market Returns

I get a quarterly publication from a brokerage company. The issue before the presidential election had a little article thingy with the title “Will Investors Win or Lose on Nov. 4?” Now that’s just a blatant argument-starting, trying-to-be-controversial headline. It implies that one side of the election will cause investors to lose money and the other side will cause gains.

But the text just under the headline shows that investors have come out ahead under both parties. So the headline should have been “Which Political Party Has Been Better For Stock Market Returns?”

The article went back 6 presidents under each party (Democrats and Republicans). It started in 1933 under FDR (coincidentally, that was just after the crash of 1929 was done and the market was headed up). The results were that $10,000 invested only under Democrat presidents would grow to $315,000 whereas $10,000 invested only under Republican presidents would grow to only $74,000. The Democrats had 40 years of presidencies and the Republicans had 36. Even if I removed 4 years of Democratic presidency, I wouldn’t expect the numbers to be much closer.  And other studies have the same results.

Those 76 years of data might be enough for a reasonably large sample, but I thought I would conduct my own investigation and go back farther. I started with the 1900 elections and checked the S&P500 (or equivalent) every 2 years, coinciding with the congressional and presidential election cycles. I had to get the 1898 stock prices too, so that I could get returns for that first election.

My results show that yes, the market has gone up more under Democrats than under Republicans. There have been papers published about this correlation, and some researchers and journalists are wondering why investors don’t notice this and invest accordingly. “Invest accordingly” would mean put money in the market under a Democrat president and take it out under a Republican.

The main answer is that the market still goes up under both. Investors know that leaving their money in the stock market long term (regardless of which party is in the White House) is the best policy. If investing were as simple as putting your money on a political party, it would have been figured out a long time ago.

I don’t know the exact method that the article writers used. Mine was rather simple and I expect it has some flaws. I started with $10,000 and had it go up or down by whatever percent the market did from the start to the end of a given term. I didn’t use exact days of the president’s terms, as did the article. My data was the price of the market, every 2 years, at the transition from one year to the next (close of December/beginning of January). But my numbers did approximate the article’s numbers, so my method was good enough for generalizations.

The article had the market returns as 5 times better under Democrats ($305,000 gain versus $60,000 gain). My results showed about 3 times better returns for the Democrats, but mine were $200,000 versus $70,000 (rounded).  The article did not include inflation as a factor.

Say that the market doubled under a president. Go ahead, say it. So you started with $10,000 and ended with $20,000. That means you made $10,000 and you are $10,000 richer and can buy more stuff than you could before, right? But what if inflation totaled 100% under that president’s term, so that the cost of everything also doubled under his watch? Although your money doubled, your value didn’t. All you did was stay even. So if one president had the market go up 8% but inflation was also at 8%, should he be considered better for investors than a president who had the market increase only 6% but kept inflation to 3%? I contend not.

I factored inflation into the mix, using numbers provided conveniently by Robert Shiller, and found that returns evened out significantly. The results changed to $23,000 for the Democrats and $21,000 for the Republicans. That still had the Democrats ahead officially (1.8% annual return vs. 1.2%), but realistically there is not much difference. At least not enough on which to build an investing strategy.

The article also did not include Congress as a factor. The President of the United States of America has some power, but Congress has a lot to do with monetary policy as well. I factored Congress into the mix, using the records of the Senate and House of Representatives. Because Congress has two divisions, the results got complicated: 3 entities and 2 parties means 8 categories.

I tried to simplify things, but I still wound up with a bunch of categories.  I have listed the results of what $10,000 would become under those terms, along with the annualized rate of return.  I used just the years that the money would be in the market, not the time of the whole study, as that seemed better for comparison.  So each category has a different time base for the annualized rates (President: Rep. 62 years and Dem. 48, House: Rep. 44 years and Dem. 66, Senate: Rep. 50 years and Dem. 60).

“n” means “not adjusted” and “i” means “adjusted for inflation”

Single Indicators:

  • President Only:
    Democrat: $202,000 (6.5%) n / $23,000 (1.8%) i
    Republican: $79,000 (3.4%) n / $21,000 (1.2%) i
  • House Only:
    Dem: $342,000 (5.5%) n / $24,000 (1.3%) i
    Rep: $47,000 (3.6%) n / $20,000 (1.6%) i
  • Senate Only:
    Dem: $143,000 (4.5%) n / $6,100 (-0.85%) i
    Rep: $112,000 (5.0%) n / $51,000 (3.3%) i

Compound Indicators:

  • All Three Matching:
    Dem: $106,000 (5.8%) n / $22,000 (1.9%) i
    Rep: $16,000 (4.0%) n / $11,700 (1.5%) i
  • President Opposite Congress:
    Dem. Pres, Rep. Con.: $25,000 (9.6%) n / $16,500 (5.1%) i
    Rep. Pres, Dem. Con.: $17,800 (2.7%) n / $6,900 (-1.7%) i
  • Mixed Bag (split Congress):
    D. House, R. others: $19,300 (8.6%) n / $14,300 (4.6%) i
    R. House, D. others: $8,100 (-10.6%) n / $5,700 (-24.7%) i

The best single indicator, accounting for inflation, is the Senate.  The President and the House of Representatives are almost a wash when it comes to returns after inflation.  But the Senate – the difference there is quite obvious.  A negative return for the Democrats versus a strong positive return for the Republicans.  I say strong positive because it is about twice the return rate that you’d get if you played the presidency.

And you could play around with the compound indicators some more.  I wouldn’t put too much stock in the Mixed Bag category, since the second one (-25%!) was only two years.  It may have no correlation to anything at all, but it’s a fact that the worst combination for the stock market was a Democratic president with a Republican House and Democratic Senate.  You’re not going to be able to prove cause and effect, but you could sure make a headline out of it.

If you ever need something to do, you could waste a whole day just playing around with market returns to come up with statistics that benefit your particular party or cause. Or read someone else’s investigation of the issue. There are even futures markets for presidential elections (that’s a link to the old blog. The new one, but without that post, is here).

In conclusion, don’t trust dramatic headlines and don’t invest based solely on presidential political party. Now you can consider yourself a more enlightened investor.

“But you shall remember the LORD your God, for it is He who is giving you power to make wealth, that He may confirm His covenant which He swore to your fathers, as {it is} this day.”
– Deuteronomy 8:18

Don’t Waste Your Shower

As it is frigid outside and the furnace is running much of the time, we use humidifiers.  We have a couple of stand-alone units that spend most of the year in the garage.  But they are back in the bedrooms, helping keep people from drying out.

Just about everyone has at least one humidifier in his house.  It’s called a shower.

I leave the bathroom door open when taking a shower.  What do we want in winter?  Warm moist air.  What is in the bathroom during a shower? Warm, moist air.  Why run the bathroom fan and send all that good air outside, just so you have to run the furnace some more to replace that warm air that left the house?  Send all the humidified air to the other parts of the house instead.

On a somewhat related note: why does the garage freezer run when it is below freezing outside?  We have a freezer in our unheated garage.  The temperature in the garage has been well below freezing during the previous two weeks, but I would go into the garage for something and the freezer would be running sometimes.  I’m tempted to unplug it and leave it open during the winter.

While the earth remains, Seedtime and harvest, And cold and heat, And summer and winter, And day and night Shall not cease.

Genesis 8:22

Nail File, Part 2

Several months ago, I wrote about how my fingernails developed a sudden, temporary infection.  Now the nails have all grown back.  When the whole thing started, I was wondering how long it would take for them to have no sign of the infection.

Now the whole thing is over, and I can pass on to you, dear reader, the knowledge I have gained: my nails took 4-6 months to grow.

That time is the complete re-growth of the nail, from the time of the infection to the time when the last sign of nail problem was gone.

The nails at first grew bad, then they grew good again. When the infection happened, it interrupted my nails. It was like my normal fingernails just kept going like they would have, but there was not any new nail behind them so they eventually fell off. This picture is from that point, halfway through the ordeal. Click on this preview photo if you want to see the details.

Preview picture of fingernail problem

The new nail started growing before the old nail was completely gone, but the new nail was warped and mis-shapen. Then everything settled down and got back to how it should be, but the warped parts of the nails still had to grow their way off my fingers. Once that was done and a fingernail was clear, with no evidence that there had been any problem, I noted the day.

My nails went bad on 6/21/08

left index fingernail healed on 10/25 – 4 months
right index fingernail healed on 10/31 – 4 months

left middle fingernail healed on 12/19 – 6 months

left ring fingernail healed on 12/19 – 6 months
right ring fingernail healed on 1/2 – 6.5 months

left pinkie fingernail healed on 12/5 – 5.5 months

My right middle and pinkie fingernails and both thumbs were not infected, so there was no time to record there. Rumor has it that nails are like bones in that they benefit from mild stress of everyday use. I’m guessing that my index fingernails grew the fastest because, in my job which involves a lot of computer use, I used them the most. And I am left-handed, so my left nails grew faster than the right.

The pinkie was next, probably because of the typing and my habit of tapping my pinkies and thumbs on nearby objects, to the beat of whatever song happens to be in my head. It annoys my wife, especially when the nearby object is her.

Blessed be the LORD, my rock, Who trains my hands for war, {And} my fingers for battle;

Psalm 144:1

All-Haiku Bowl Results

Before the bowl games commenced for this past college football season, I made some predictions. Here, for your reading enjoyment, is the tally of those predictions. Note that the results are not in haiku form, in contrast to the predictions.

The numbers in parentheses are the CBS Sportsline 120 rankings, which is supposed to show where a team ranks in all of Division 1 (formerly known as FBS).  In theory, a team with a higher ranking (lower number) should beat a team with a lower ranking.  These rankings were gathered before the bowl games started; they are slightly different now.  I decided to check CBS’ accuracy also, so those numbers are included.

I also wanted to check a couple of methods mentioned by TMQ: Home Team Wins (HTW) and Isaacson-Tarbell Postulate (ITP – the team with the better record wins; if records are equal, home team wins).  So an ‘H’ is listed after the team that was the official home team for the game.  However, the official home team was not always the real home team, as the bowl game was sometimes closer to the visitor.  For example, Oklahoma was the official home team for the BCS championship game, but the game was held in Florida, so the Gators were the home team by location.

Here is the list (Some Blog Site’s prediction first – actual result second):

Navy (56)H over Wake Forest (51) – WF beat Navy
BYU (16) over Arizona (48)H – AZ beat BYU
South Florida (50)H over Memphis (79) – USF beat Memphis
Fresno State (58)H over Colorado State (68) – CSU beat FSU
Troy (59)H over Southern Miss (72) – So Miss beat Troy
Boise State (9) over Texas Christian (11)H – TCU beat Boise
Hawaii (67) over Notre Dame (65)H – ND beat Hawaii
Central Michigan (53)H over Florida Atlantic (85) – FAU beat CMU
California (30)H over Miami (49) – Cal beat Miami
Florida State (28)H over Wisconsin (41) – FSU beat Wisc
West Virginia (31) over North Carolina (32)H – WVU beat UNC
Northern Illinois (82) over Louisiana Tech (57)H – LTU beat NIU
Northwestern (22)H over Missouri (25) – Missouri beat NW
Rutgers (40)H over NC State (52) – Rutgers beat NC State
Oklahoma State (14) over Oregon (15)H – Oregon beat OK State
Western Michigan (35)H over Rice (34) – Rice beat WMU
Maryland (37) over Nevada (46)H – Maryland beat Nevada
Georgia Tech (13)H over LSU (54) – LSU beat GT
Kansas (44) over Minnesota (55)H – Kansas beat Minn
Boston College (24) over Vanderbilt (60)H – Vandy beat BC
Oregon State (27) over Pittsburgh (18)H – OS beat Pitt
Air Force (42)H over Houston (47) – Houston beat AF
Nebraska (29)H over Clemson (38) – Nebraska beat Clemson
Georgia (17) over Michigan State (20)H – UGA beat MSU
Iowa (26)H over South Carolina (39) – Iowa beat USC
Virginia Tech (19) over Cincinnati (12)H – VT beat Cincy
Penn State (7) over USC (5)H – USC beat PSU
East Carolina (33)H over Kentucky (62) – Kentucky beat ECU
Texas Tech (6)H over Mississippi (23) – Miss beat TT
Utah (8) over Alabama (4)H – Utah beat Bama
Buffalo (43) over Connecticut (45)H – UConn beat Buffalo
Texas (3)H over Ohio State (10) – UT beat OSU
Ball State (21)H over Tulsa (36) – Tulsa beat Ball State
Florida (1) over Oklahoma (2)H – UF beat OU

And here are the results:

  • Some Blog Site picks were 14-20
  • CBS picks were 16-18
  • HTW was 13-21 for the official home team
  • HTW was 19-15 for the actual distance home team
  • ITP was 11-23 if using the official home team
  • ITP was 15-19 if using the actual distance home team

What does this mean to you? It means that you should pick bowl game winners based on whose campus is closer to the bowl’s stadium. That was the only method that had a winning record.  That is, if you don’t want to research much.

Why don’t the other methods work?  Well, anything based on the official, listed home team is going to be off because the home team advantage has to do with the fans at the game, familiarity with the area, and travel fatigue.  So Oklahoma had no advantage being listed as the home team, and Florida had all the advantages.

Why was ITP worse than the straight-up rankings?  Because ITP was designed for the NFL, where conferences don’t mean as much and there are more cross-division games.  Yes, the NFL has some conferences that are tougher than others.  But they won’t be totally insulated from the other conferences as can happen in college.  So a team with a better record (the heart of ITP) in a weaker college conference can be much worse than another team with a worse record.  The difference is still there in the NFL, but the severity is much less.

Plus, the bowl selection committees want good games, in general.  So they pick teams that will match well with each other.  The bowls are, in effect, handling the parity for you.  So you know that an 8-5 Troy isn’t that much better than a 6-6 So. Miss.

Since the strength of the conference has something to do with the results, I thought I would tally each conference’s bowl game record for the 2008 (and the first bit of 2009) season.

Conferences

  • ACC: 4-6
  • Big 10: 1-6
  • Big 12: 4-3
  • Big East: 4-2
  • Independent: 1-1
  • MAC: 0-5
  • MW: 3-2
  • PAC10: 5-0
  • SEC: 6-2
  • Sun Belt: 1-1
  • USA: 4-2
  • WAC: 1-4

So the best conference was the PAC-10 and the worst was the MAC.  Perhaps you could say that the ACC was the best because they had ten teams go to bowls.  Or you could say the SEC was the best because they won the most bowls.

My two cents: have the best teams from the best conferences play each other in a +1 playoff.  That would mean having the PAC-10 winner (USC) face the Big East winner (Cincinnati) and the SEC winner (Florida) face the Conference USA winner (East Carolina), and then the winners of those two games would play for the championship.  Of course, that is based on after-the-fact bowl results to know which conferences were the strongest.  Plus it doesn’t get Utah in there, which they should be somehow.  How do you know which conferences are the strongest before the bowl games?  Good question.

“For we know in part and we prophesy in part;”
– 1 Corinthians 13:9

Winning Children

Sunday morning in our house: “Whoever gets their coat and boots on first is the winner.” is what I heard coming from the children as they were getting ready to head out the door for church.  One child, the one who did not call out the terms of the game, got his coat and boots on and was out the door first.

As he was leaving, the first child changed it to “Whoever gets their coat and boots on second is the winner.”  When I got to the van, they were both angry at each other, because the first loser was telling the other that he was the loser, and the real loser was mad for losing, and so on and so forth.  They both got in trouble for that little exchange.

That evening, as they were getting ready to go out again, I heard the same child start the routine again, “The first…” but I think he learned his lesson from earlier that day, because it was different this time: “…two people who get their coats and boots on are the winners.”  And then when they both got ready and out the door, the one said “We’re both winners!”  And everyone was happy.  Eventually, they’ll have to learn that not everyone can win all the time, but that’s good for now.

Then a couple days later, we happened to be having ice cream after dinner.  I notice the younger child stand on his chair and raise both fists in the air.  What was that all about?  “I won!  I finished my ice cream first!”  And then after he and his brother finished and cleared their places, he noticed I was still eating.  He couldn’t let that go: “You’re the loser! You’re the loser! You’re the loser!

Also, he will race me up the stairs or outside to the van.  When he wins, which he always does, he will sometimes tell me “I won you!”  It’s so fun hearing that, I don’t feel like correcting him with “It’s ‘I beat you.’

Stay with him a few days, until your brother’s fury subsides,

Genesis 27:44

Nail Board Craft

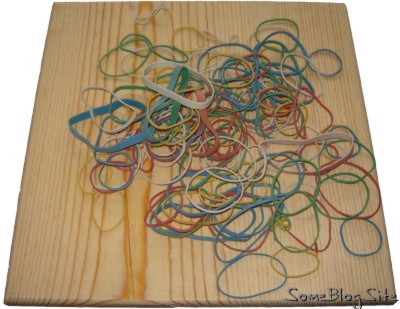
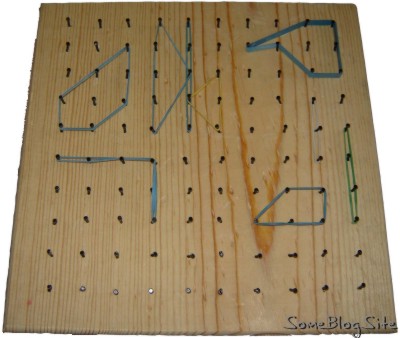
One of the other craft things we did over the Christmas break was rubber-band nail boards.  These are the boards with lots of nails/pegs so that someone can stretch rubber bands in various shapes.  This was our do-it-yourself/build-your-own craft for the week.  The kids like playing with these at the children’s museums (musea?), so my wife thought they would like to have their own.

Cost:

  • 1×12 board (4′ long): about $5
  • a box of 1″ panel nails (250 count): about $3
  • a box of rubber bands: about $1

Total: $9

Time:

  • cut and rout boards: 15 minutes
  • mark points on the board: 5 minutes
  • pound nails into the board: 30 minutes

Total: 50 minutes

The kids spent about 30 minutes playing with the boards after they were done, so it’s a little pricey at $9 per child-hour of play.  But I expect the rate to come down as they play more.

Details:

I started with a 1×12 board and cut it into a couple of 12×12 squares so that each child could have his own board.  Then I routed the edges so that they were not so sharp – better child-friendliness.

start of the nail board craft

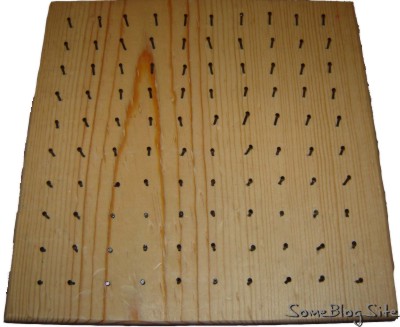
Then I marked a grid of 100 dots to show where the nails were to go.  I spaced them 1 inch apart, as that worked out rather nicely for the 12×12 square.  Then the 3-year-old helped me pound in the nails.  I started by drilling starter holes with a small drill bit, but it wasn’t worth it.  I thought I could just push the nails into the holes and then the child could nail them the rest of the way.  But it didn’t work that way.  It was easier for me to just start nailing – hit the nail a couple of times and then let the kid finish the nail.  I did have to watch it though and tell him when to stop pounding.  Otherwise he would put the nail all the way down into the board.  Since the nail is slightly longer than the board is thick, that would be a problem.

nail board craft with nails

The nails did not end up to be very straight, but that’s not all the 3-year-old’s fault.  I did the second board by myself and the nails were similarly crooked.

end of the nail board craft

The words of wise men are like goads, and masters of {these} collections are like well-driven nails; they are given by one Shepherd.

Ecclesiastes 12:11

Mad-On, Mad-Off

Madoff is under investigation for $50 billion Ponzi scheme.  My first thought when I heard that was “where did all the money go?  How can one guy lose (or spend) $50 billion?”

Remember, the Ponzi schemes are legal, but only if you are the government.  Then you can call it Social Security and people will accept it.  Civilians are not allowed to setup Ponzi schemes, because the government does not like the competition.

I heard some news stories after the deal, and of course they included the standard warning about “If it is too good to be true, it probably is.”

That gave me an idea about the next big scam.  Now Madoff did well because his returns were not sky-high.  They were on the upper side of average, but the scam clue was that the returns were always positive and in the same range.

Some people, in hindsight, were saying that should have been the tip-off.  That, and his books were not audited by an independent third party.

Anyway, the next big scam should involve some guy who gets returns right around what the market is giving.  The average mutual fund return slightly below the market, so a good scam would go up and down with the market to alleviate the concerns about being too good to be true.

This has the added benefit of better gains for the scammer.  Now he doesn’t have to give back so much of his take in order to appear like a good fund manager.

Of course, if his returns aren’t much different from the market’s, then it might be hard for him to attract investors. Oh well, maybe that’s why I’m not a con man.

Disclaimer: this was written to alert the good citizens of this country to possible scams, not give suggestions to devious scammers.

“Behold, I send you out as sheep in the midst of wolves; so be shrewd as serpents and innocent as doves.”
– Matthew 10:16