Today’s post will be rather boring for many people, so feel free to skip it if you want. I’ll understand.
I don’t gamble in casinos, but I make up for it by playing the stock market. Any day now, I’ll pick the right stock and be able to retire early.
I’m not a day trader – more like a week or month trader. And it’s not much of a gamble, because I’m not risking a lot on it. I play with about 5% of my retirement money. And since a normal retirement would be 30 years away, I have some time for playing.
I created a stock screener at my online brokerage. Normally, I would sift through those results and see if any stocks looked interesting enough to buy. But then I got a different idea:
What if the number of stocks returned by the screener meant something?
and not necessarily the stocks themselves.
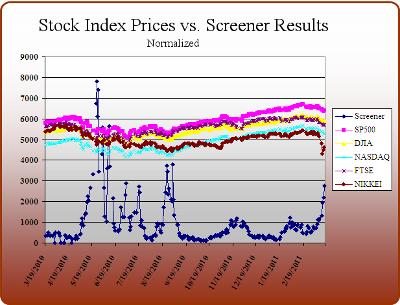
I guess I was hoping that my screener was inadvertently a leading indicator. So I graphed the number of stocks from my screener against various indices, in order to see if I could find some correlation between the market and my screener.
For the last year (actually March 2010 to March 2011), I ran that screener near the end of each trading day. I missed a few days, but got most of them. You can certainly see a trend:

Unfortunately, all it does is mirror the index price. The number of stocks approved by the screen goes down as the stock market goes up, and vice-versa. While interesting, it doesn’t tell me anything I couldn’t know by looking at the market data without my screener.
Also unfortunately, it doesn’t tell me what the market is going to do.
Maybe I’ll fiddle with the screener and keep up this hobby of mine. There’s not much of a net loss (or gain), so I suppose it’s harmless.
He who loves money will not be satisfied with money, nor he who loves abundance with its income. This too is vanity.
Ecclesiastes 5:10


 This is Alpha, the first-born, when he was 2YO.
 This is Beta, the second-born, when he was about 2YO.
 This is Gamma, the third-born, when he was about 18MO.


